Data lacked physical meaning
Tables and model output did not clearly explain coverage, obstacles, or downstream impact.
03 · Network data intelligence
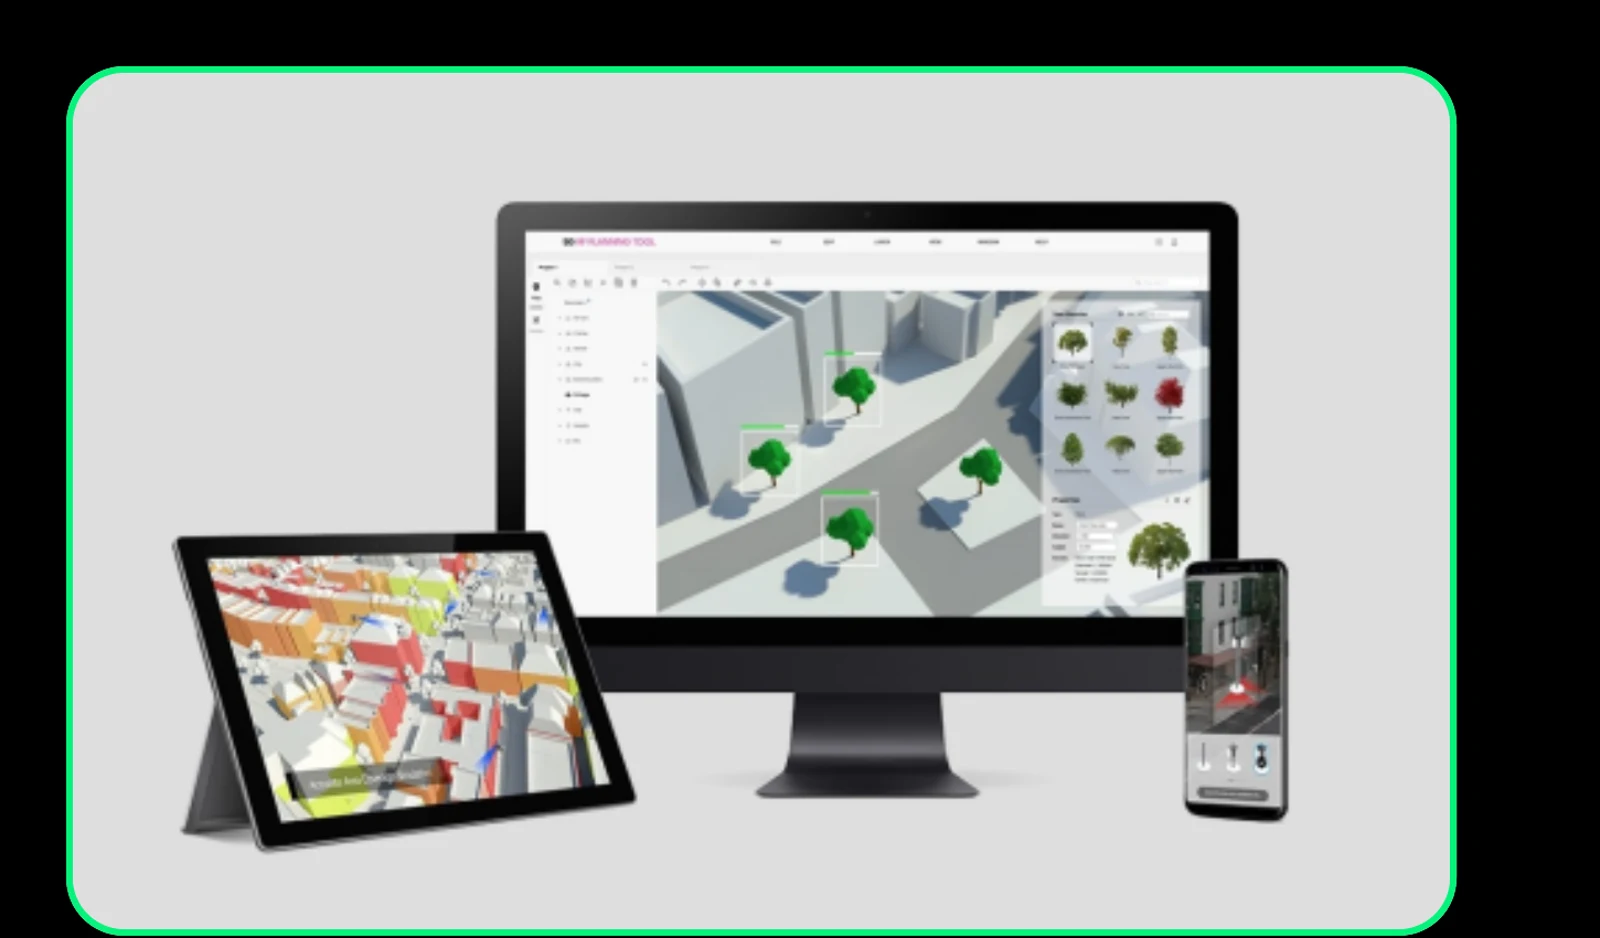
A cross-device 3D platform that helped operators, modelers, and AI data scientists turn complex network signals into planning decisions.
The challenge
The system had powerful network data and AI-assisted analysis, but experts still needed a usable way to understand the physical world behind the numbers.
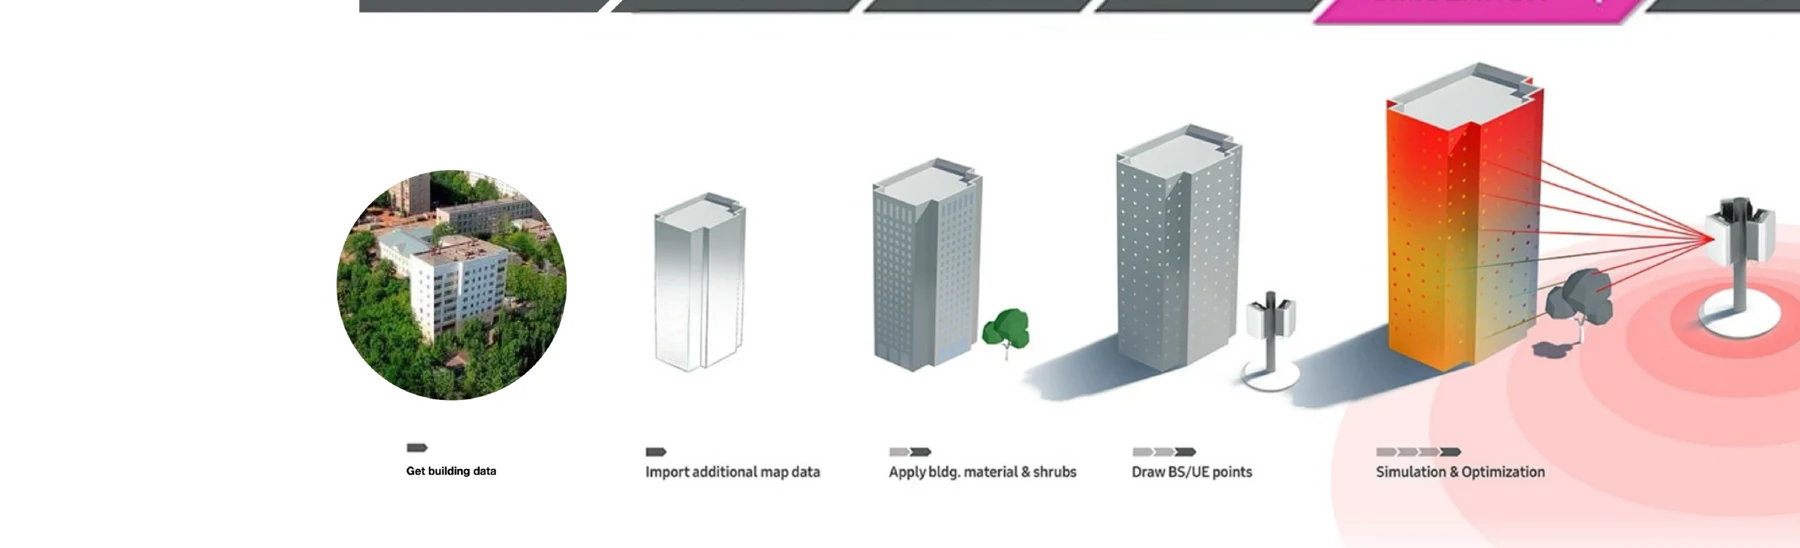
Planning required users to assemble map data, model buildings and equipment, run simulations, and interpret dense results. I reframed the product around one spatial decision journey rather than a sequence of specialist tools.
Tables and model output did not clearly explain coverage, obstacles, or downstream impact.
Repeated setup and context switching slowed expert decisions.
Research, engineering, and regional operators needed shared interaction rules.
Experience architecture
The architecture connected raw spatial data to a semantic 3D model, simulation inputs, calculated results, and a decision. It gave specialists a shared language while allowing each role to enter at the level of detail they needed.
Foundation for agent supervision
This work predated today's agent and MCP ecosystem, so I do not present it as an agent product. It established the same management principle: make machine analysis observable, connect output to spatial evidence, support scenario comparison, and keep consequential decisions with the expert.
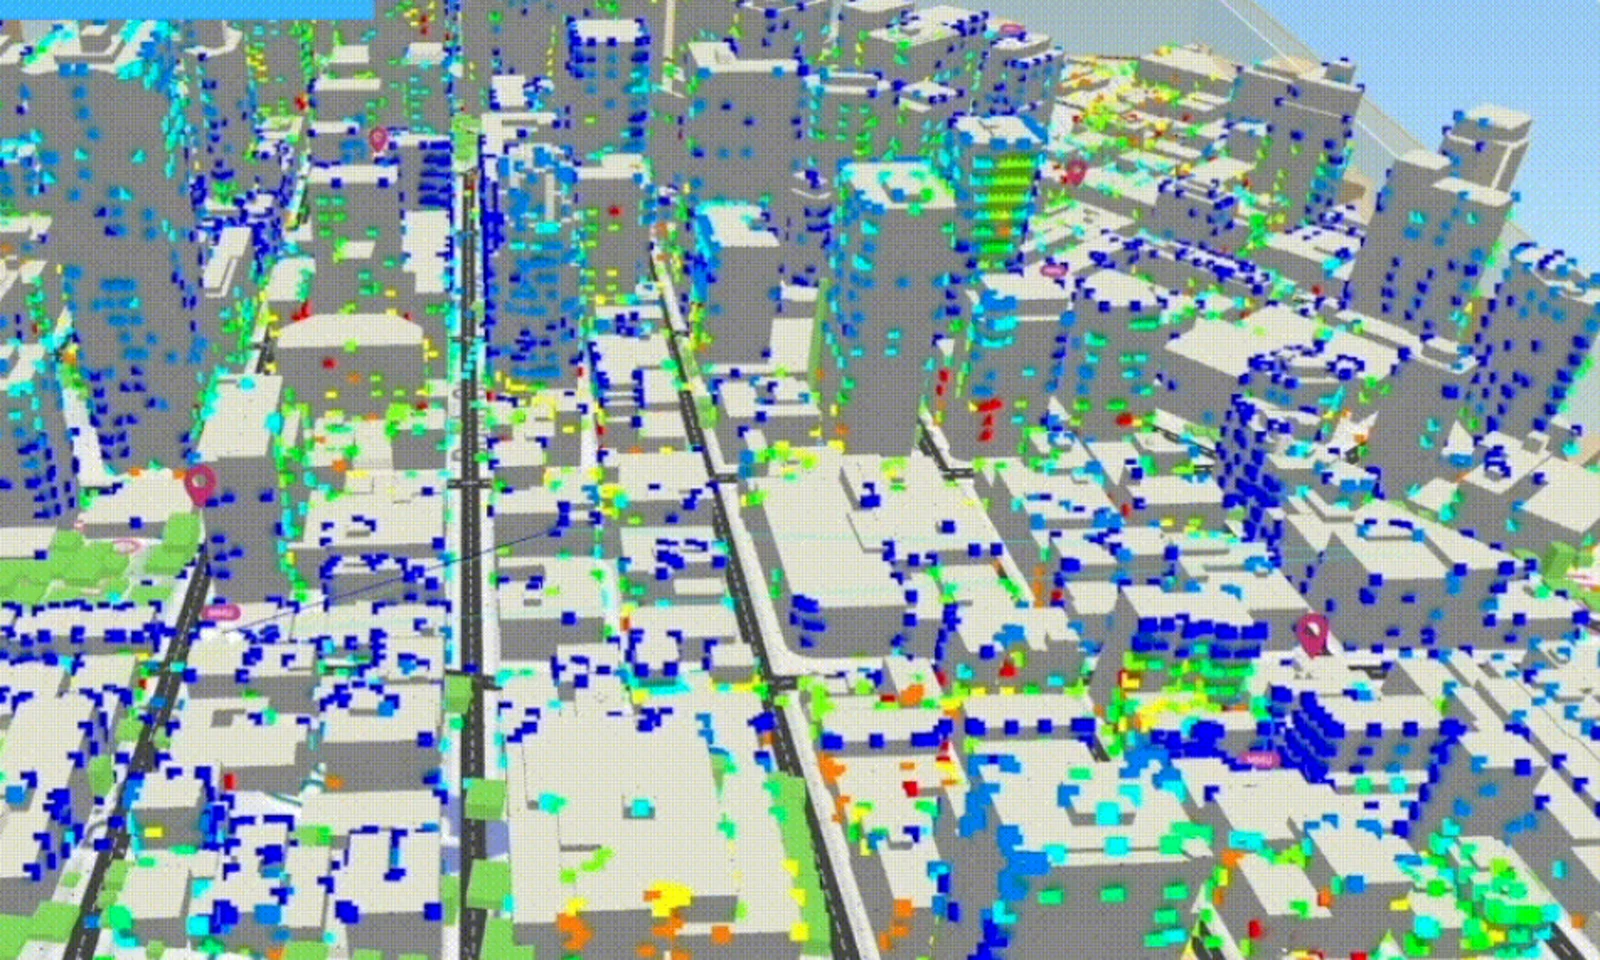
The model could calculate and recommend. It could not approve a deployment choice. That human-control pattern now informs how I design agent plans, observability, approval, and intervention.
Evidence, trade-offs, reflection
Network planners, researchers, modelers, and field specialists needed to inspect the same network evidence at different depths across desktop and field workflows.
Workflow observation and usability evaluation connected interaction changes to comprehension, adoption, completion time, and dropout rather than judging the 3D interface on appearance alone.
Showing every model layer improved technical completeness but obscured decisions. I used semantic layers and progressive detail so experts could reveal complexity when it became relevant.
I would involve regional operators sooner and test device constraints earlier, reducing the adaptation required as the platform expanded across markets.
System leadership
I created shared specifications for foundational controls, data visualization, and spatial interactions. Monthly UX sprints connected research, product, engineering, and regional needs; the system made desktop and field experiences feel related without forcing them to be identical.
Navigation, editing, status, and validation established predictable behavior.
Color, layers, legends, and comparison rules made model output interpretable.
Selection, placement, camera behavior, and progressive detail supported expert work.
The redesigned workflow raised measured system usability.
Usage increased across the first six months after rollout.
The connected workflow cut a representative planning task roughly in half.
Fewer users abandoned the workflow before completing a plan.
The platform system supported adoption across regional contexts.
Shared layers reduced conflict and repeated design decisions across teams.
Return to